1) There are 11 ozone monitoring stations in the Atlanta Metropolitan Statistical Area.
 |
| the locations of the monitoring stations |
2) An HOD is a high-ozone-day and they are most common from June to August, the warmest season in Georgia.
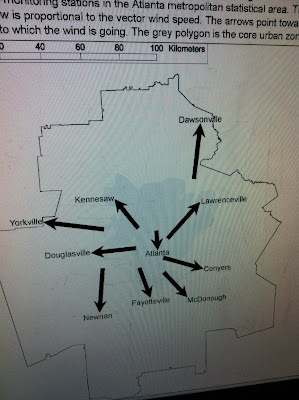
3) The southeastern part of Atlanta (McDonough, Conyers, Panthersville stations) generally observe the highest ozone levels, and the northerly-located stations of Yorkville and Dawsonville had the lowest levels.4) HODs occur with hot, dry and calm weather.
5) HODs are associated with nitrogen oxide emissions from electric power plants.
6) HODs are perpetuated by above-average mixing heights above ground level (in the air) which causes it to spread over a larger area of the atmosphere above the Atlanta MSA.
 |
| HODs and wind direction |
Some of the other things we learned from the presentation, about...
- Particulates
1) Small particulate concentrations in urban areas are caused by fossil fuel burning, mostly by automobiles.
2) On-road emissions and power plants also attribute to particulates in the air.
3) Places with high particulate optical depth include: the Sahara Desert due to dust, the Amazon rainforest from August to October due to biomass burning of forests, China and its coal-burning particulates, and the eastern half of the United States during the late summer months. (see photo below)
 |
| part of an animation showing change over time |
1) The lowest levels during the day are recording in the early morning, around 7:00am.
2) Towns to the south of Atlanta have the highest o-zone levels because they are downwind of Ohio River Valley winds.
3) It is created by nitrous oxide emissions and volatile organic compounds, together with ultraviolet radiation, as shown in the photo below:
 |
| the "recipe" for o-zone |
1) It kills plant life, pollutes rivers and streams, and erodes stonework.
2) Pure water has a pH of about 7, while acid rain is exponentially more acidic with a pH of about 4.
3) There has been a shift in rainfall in the Atlanta area since the Clean Air Act of the mid-1970's due to small particulate matter clouds (NOx and SO2), with rainfall suppression before it and an increase after it. Observe the change below:
 |
| average rainfall in Atlanta |
- CO2
1) Fossil fuel emissions in the Atlanta MSA are approximately 4800 metric tons per square kilometer, which is 8 times more intense than the national average.
2) Most concentrations of carbon dioxide in counties around the city of Atlanta are largely due to automobile emissions.
3) There is a carbon dioxide monitoring station on the top of a GSU building which is constantly observing levels in the air in downtown Atlanta. You can see its results here:

No comments:
Post a Comment